It's time for Federal Guaranteed Employment


ridski said:
terp said:So you're calling DaveSchmidt and ml1 irrational now?
I'm quite sure you seem perfectly rational to one another.
I think they have blind spots. Dave Schmidt's correction of the graph I posted earlier and his quote of a 2 year old post did not seem to add much to the discussion except to pull us into the very details ml1 wants to avoid.
They seem to be fine with the other assertions that are bolder and are not backed up by any facts. That doesn't seem rational to me. At the least it is a display of extreme bias.
I would like to add that I am commenting on their online personas as I do not know them personally.

terp said:They seem to be fine with the other assertions that are bolder and are not backed up by any facts. That doesn't seem rational to me. At the least it is a display of extreme bias.
Objection. Assuming facts not in evidence.

Ha. Read the thread. Not only do you let those bold assertions pass unchallenged, you object to the person who challenges them. Finally, you join the person asserting that there is some kind of conspiracy in throwing your arms up in frustration.
I'm no mind reader. Thus, I am forced to look at behavior.

terp said:
I think they have blind spots. Dave Schmidt's correction of the graph I posted earlier and his quote of a 2 year old post did not seem to add much to the discussion except to pull us into the very details ml1 wants to avoid.
They seem to be fine with the other assertions that are bolder and are not backed up by any facts. That doesn't seem rational to me. At the least it is a display of extreme bias.
If you’re going to welcome MOL posters not to comment on your views, please bear with us when we don’t comment on your views.
(The careless citation of bad stats, studies, charts and quotations, which undermines good discussions, is another matter. I do have a thing about that.)
DaveSchmidt said:
terp said:If you’re going to welcome MOL posters not to comment on your views, please bear with us when we don’t comment on your views.
I think they have blind spots. Dave Schmidt's correction of the graph I posted earlier and his quote of a 2 year old post did not seem to add much to the discussion except to pull us into the very details ml1 wants to avoid.
They seem to be fine with the other assertions that are bolder and are not backed up by any facts. That doesn't seem rational to me. At the least it is a display of extreme bias.
(The careless citation of bad stats, studies, charts and quotations, which undermines good discussions, is another matter. I do have a thing about that.)
All MOL posters are welcome to comment on my views or not to comment on my views. It's really up to preference. I find it odd, though I don't necessarily have a problem with it, when a poster makes multiple comments on how they're not going to comment. That is a bit odd.
On the bad stats, charts, studies. The study from 2 years ago was fine. Some of the numbers were up for interpretation.
I found the chart of education spending on a google image search. As I had already known what the trajectory of spending was, I simply wanted to find a chart to make that point. There was not intention to mislead. The scale of 1950-1953 is completely irrelevant to the conversation. It's MOL, not my masters thesis.
I found charts on poverty as well, but I advised a google search instead. As I knew you'd find some issue with the font or what have you. I understand what you are doing when you call out irrelevant issues with an education chart and re-post a "better" chart that makes the exact same point.
LOST said:
Tom_Reingold said:I anticipate that Terp believes it results principally from government interference in the economy.
terp said:How, then, do you account for the huge growth in the disparity of wealth over the past 40 years? If it's not policy, then what caused it?
But this all stems from the argument that I and people like me are "keerazy" because we don't believe that "policy for the last 40 years has done nothing but help the wealthy at the expense of everyone else?" is a pretty empty one, and in fact I think I might call it "keerazy".
This is of course obvious. It's just not something you will point out because the person who made the assertion thinks like you do.
I realize I missed this earlier. I think there are a few reasons for this:
- Asset inflation caused by monetary inflation rewards those that have assets but costs those that don't
- Globalization of Labor pool: While this is lowering inequality on a global scale, it is causing a drag on living standards for the American worker
- Technology: Information Technology is amplifying success. This is creating big winners at an extremely rapid rate. The audience(market) you can get to quickly today is unprecedented.
Those are the big ones off the top of my head. I'm sure there are others. I don't think too much of it is nefarious or planned as stated earlier. Though, the funny thing is I think I'd be a receptive audience for Klinker on that topic.
terp said:
I understand what you are doing when you call out irrelevant issues with an education chart and re-post a "better" chart that makes the exact same point.
And you say you’re not a mind reader.
[The chart I posted gives the lie to the fairly steady postwar increase suggested by the one that caught your uncritical eye. And while my contribution may have been irrelevant to the kind of discussion you want to have, it contributed to the kind of discussion I prefer to follow, and in a concrete way: steve may have added his pertinent observation with or without my comment, but since he quoted mine, I’ll claim at least some credit for prompting it.]

DaveSchmidt said:
terp said:And you say you’re not a mind reader.
I understand what you are doing when you call out irrelevant issues with an education chart and re-post a "better" chart that makes the exact same point.
[The chart I posted gives the lie to the fairly steady postwar increase suggested by the one that caught your uncritical eye. And while my contribution may have been irrelevant to the kind of discussion you want to have, it contributed to the kind of discussion I prefer to follow, and in a concrete way: steve may have added his pertinent observation with or without my comment, but since he quoted mine, I’ll claim at least some credit for encouraging it.]
It has nothing to do with the "type of conversation I wanted to have". The point of the chart was to illustrate how untrue the statement about starvation level education budgets was. And it was untrue by any objective measure. Both charts prove that point pretty easily.
ml1 said:
some of you are acting as if we live in a perfect world where everything is shiny and new and there couldn't possibly be any meaningful work to be done.
Just in Maplewood, we could keep a crew of people busy fixing the streets, sidewalks, cleaning the parks, running recreation programs for kids, etc., etc.
Improving everyone's quality of life, even if it's in small ways, would not be "make work." I think it would be terrific if we had funding to pay people to fix everything in our town that's broken, and then keep it maintained.
I missed this too. We can talk about public works, I have to wonder why we would have this work done at the federal level. Imagine the enormous bureaucracy required to manage this. Or is that the point?
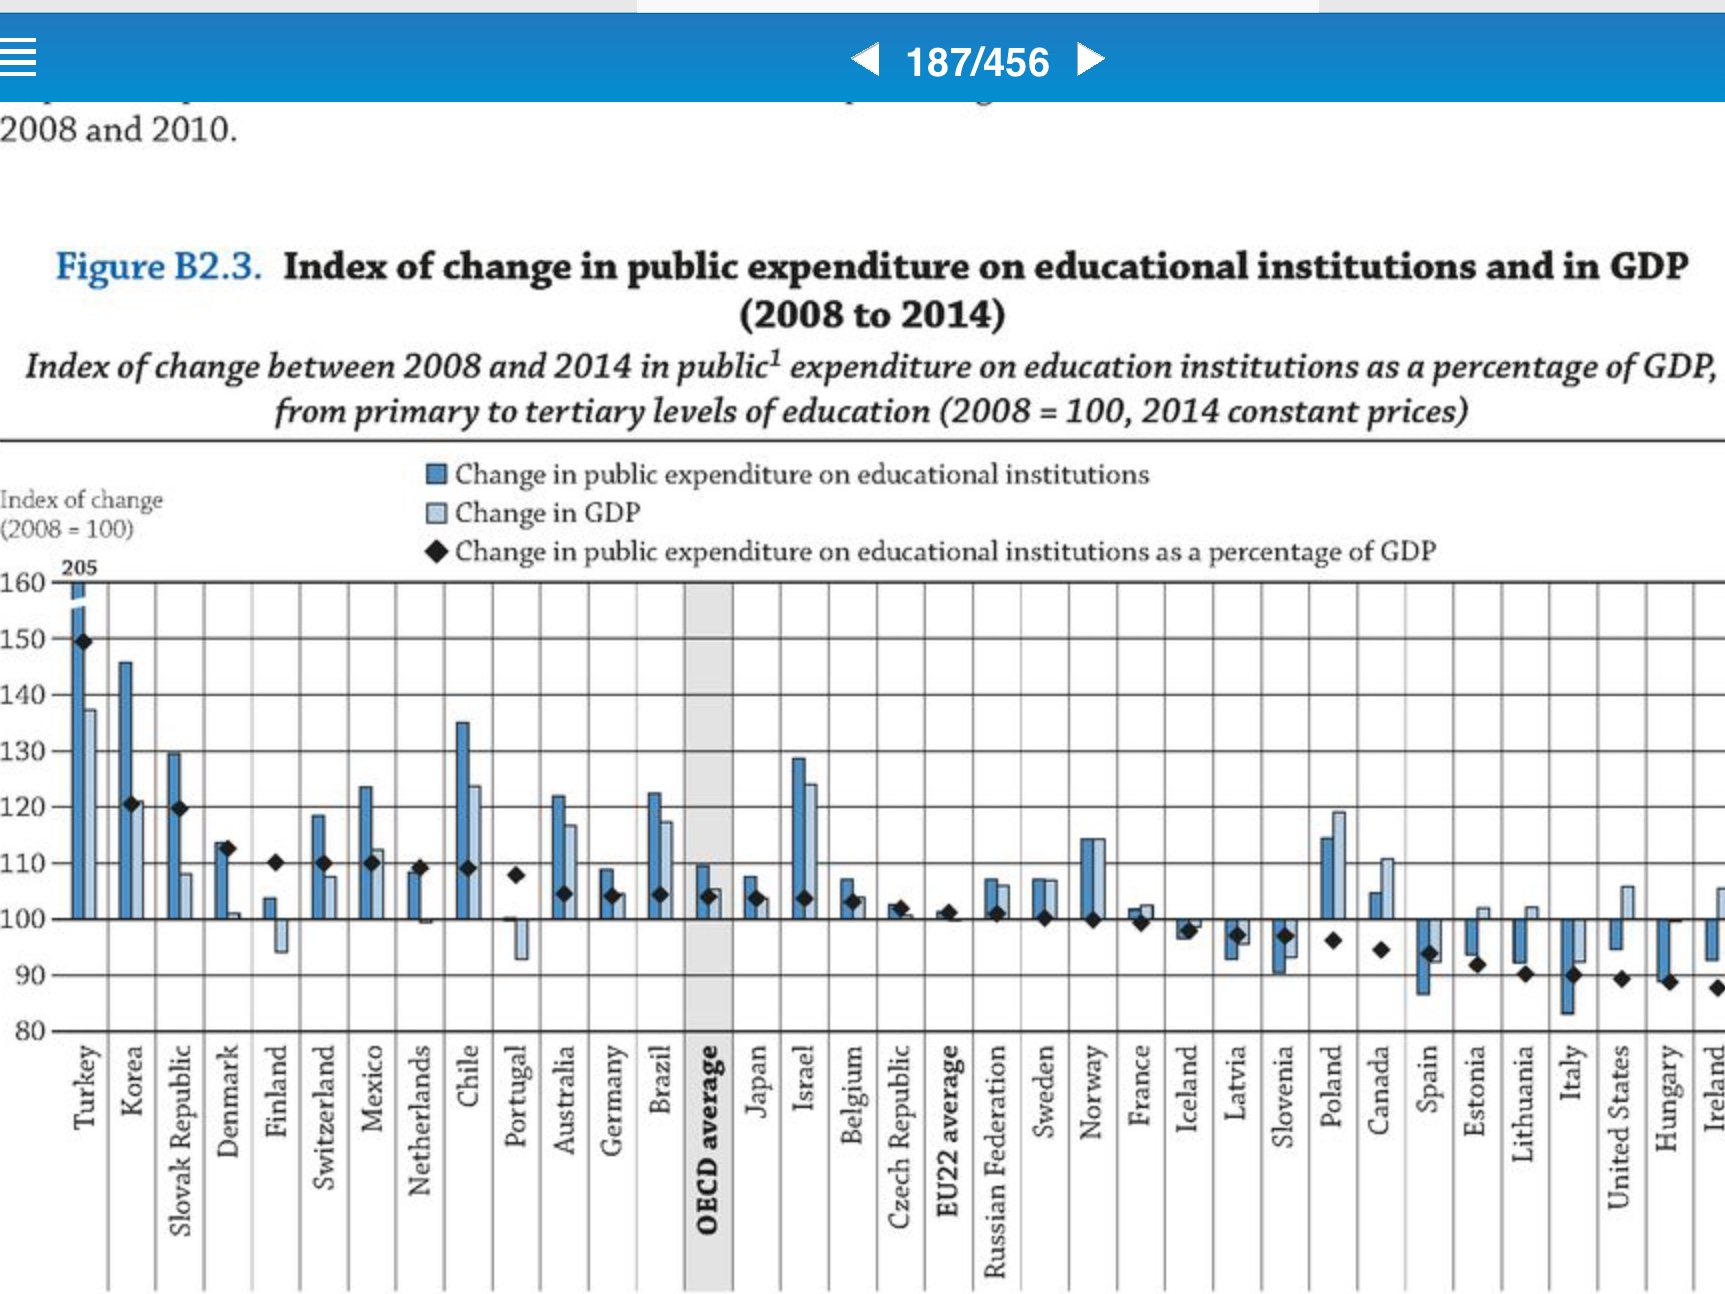
Thanks Drummberboy. I assume that is mostly due to local governments being squeezed after the financial crisis. Still, according to the article:
And even with the decline in spending, the United States still spends more per student than most countries. The United States spent $11,319 per elementary school student in 2014, compared with the OECD average of $8,733, and $12,995 educating each high school student, compared with an average of $10,106 per student across the OECD.
I suppose it comes down to how you define starvation.
I've asked this before and I've never been able to find an answer. I'm pretty sure health insurance and pension costs factor into U.S education costs. Is that the case in other countries?
I would assume the numbers are not exact. I think the dataset likely has different countries reporting differently. There are similar issues around health related reporting like infant mortality. That being said, I don't know for sure.
ml1 said:
I've asked this before and I've never been able to find an answer. I'm pretty sure health insurance and pension costs factor into U.S education costs. Is that the case in other countries?
Also, re OECD comparisons:
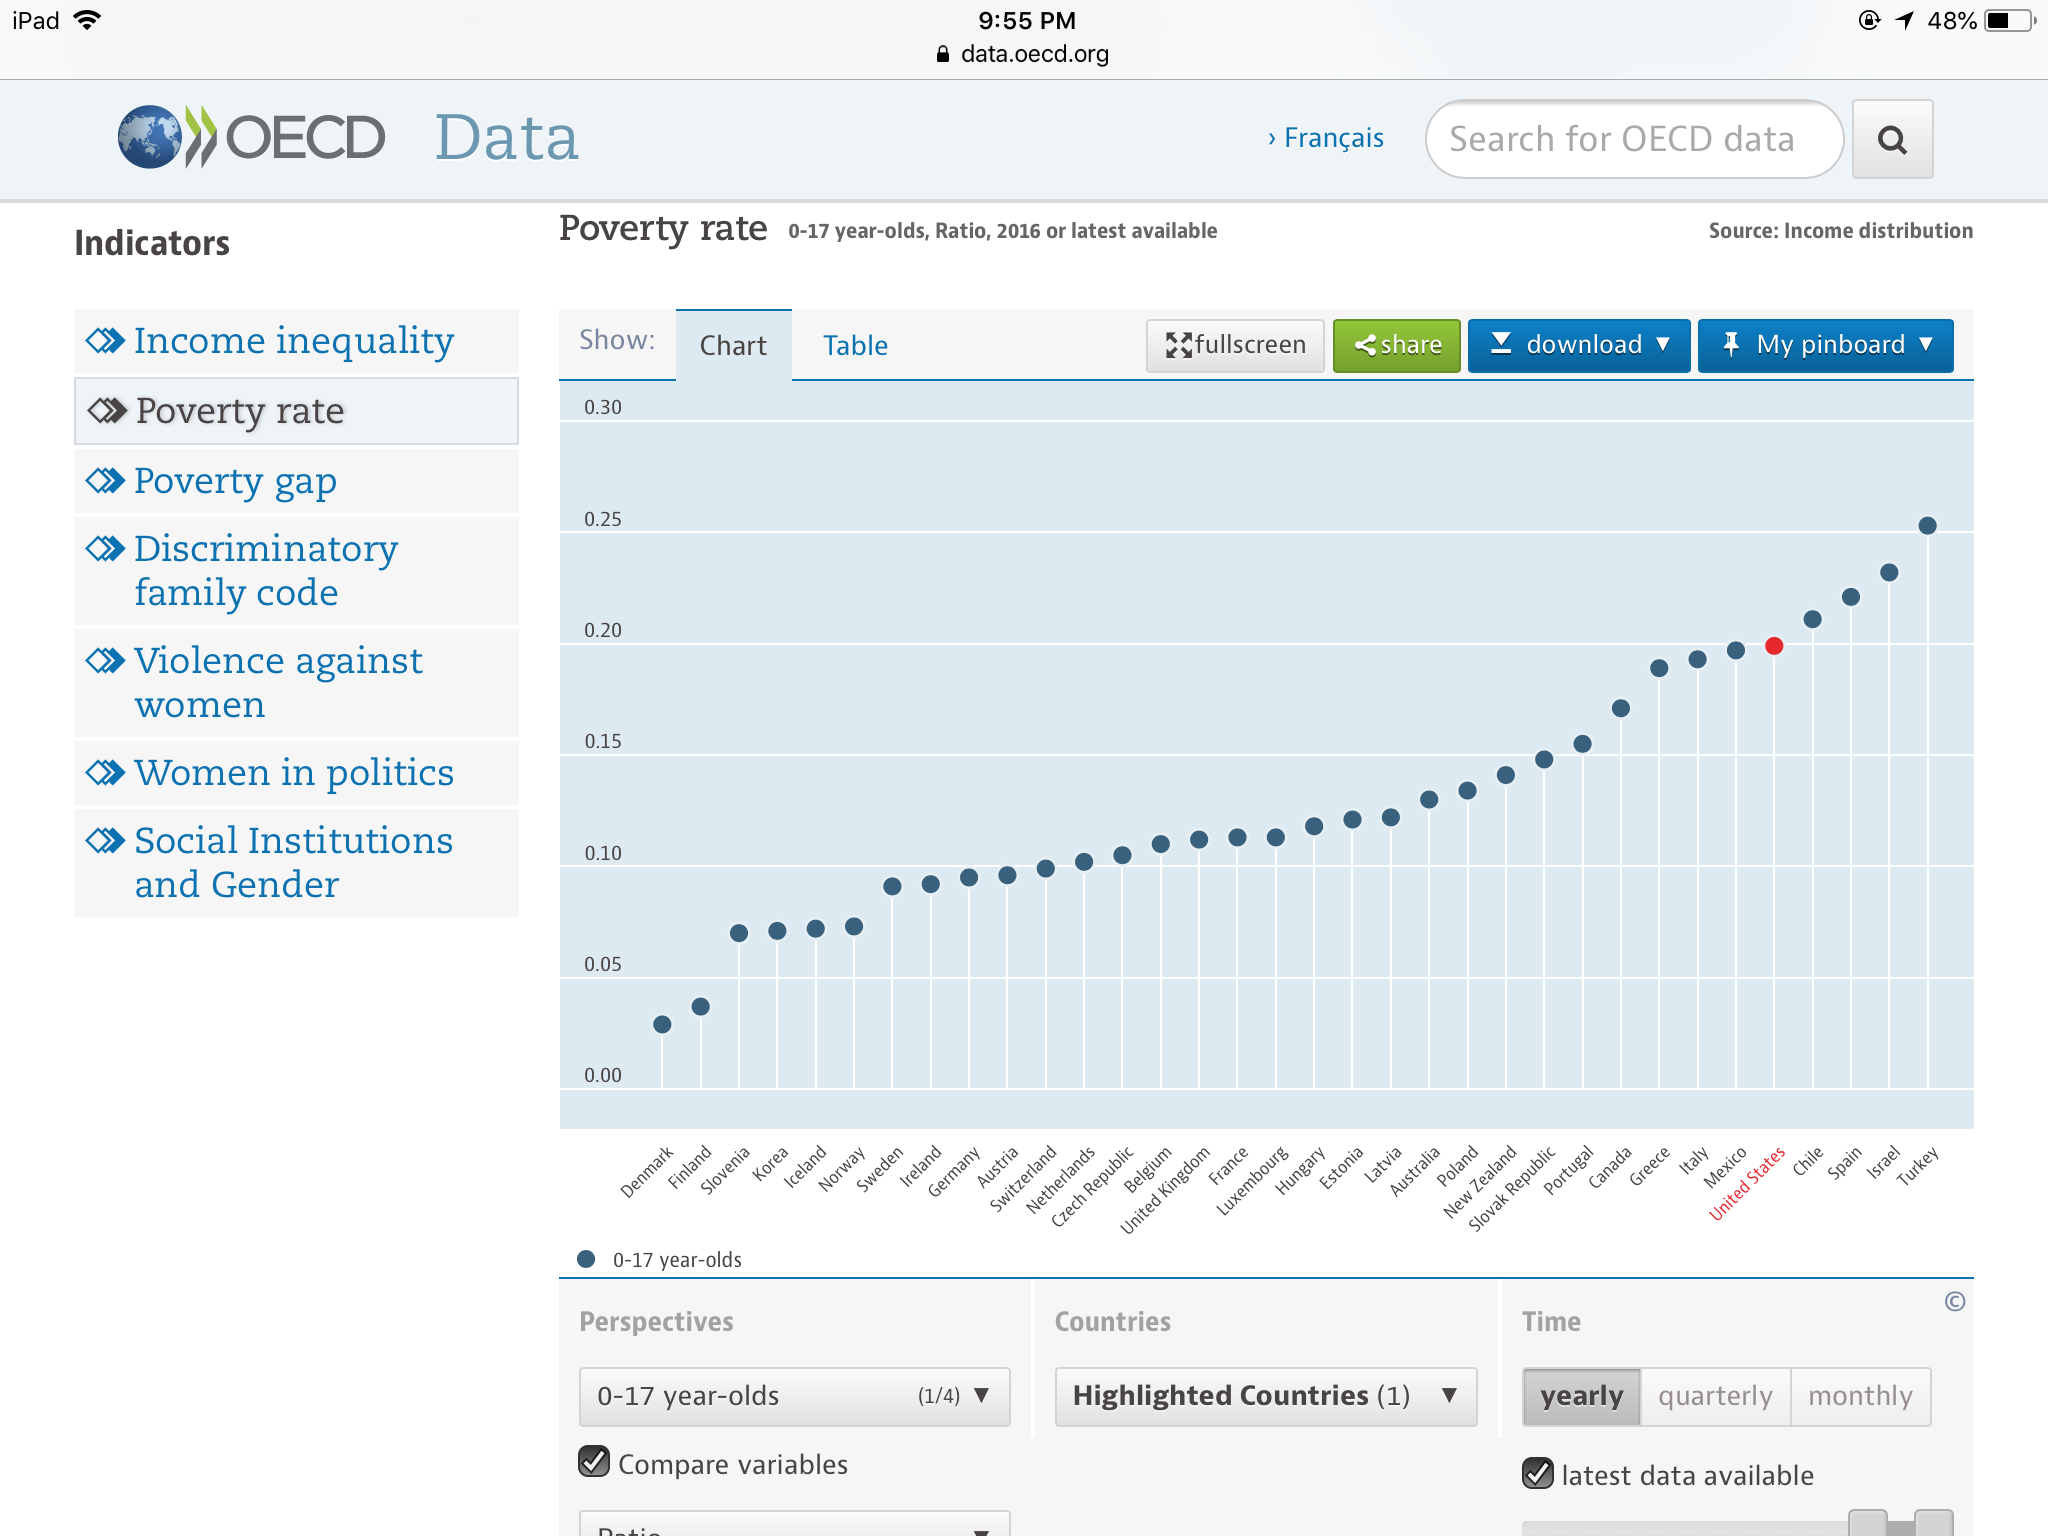

ml1 said:
I've asked this before and I've never been able to find an answer. I'm pretty sure health insurance and pension costs factor into U.S education costs. Is that the case in other countries?
I doubt health costs are included for most other countries, since they would pay for that through their national health care system budget.
Less familiar with pensions though.
Speaking of public spending on education as a percentage of GDP (this chart includes postsecondary education):

Ok, now that we have wasted a 100 posts on that nonsense can we get back to talking about Universal Basic Income and Federal Guaranteed Employment?

It's probably been said before but there would be a lot more political and public support for Guaranteed Employment than for UBI.


So you're calling DaveSchmidt and ml1 irrational now?